Power BI Formulas
Microsoft Power BI is a fantastic interactive data visualisation software that focuses on business intelligence. It's a collection of applications, software services, and connectors working together to transform unrelated data sources into coherent, visually immersive, and interactive insights.
Have you ever gotten stuck in a situation involving a dataset and wanted to work around various formulas by adding, removing, or modifying them? Sometimes we might want to find, change and replace formulas. So you may wonder, "how do I change the power BI formula?" or "Is there a Find and replace function in Power BI?" or "What is a measure, and how do you modify a measure in Power BI?". Let us discuss how to handle these situations.
Assuming you have loaded your dataset, Let us begin.
The Formula Bar in Power Query Editor
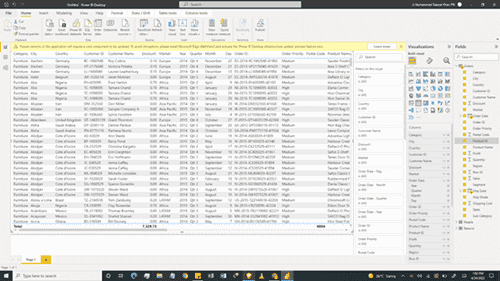
Power BI provides us with a Power-Query formula bar. Let's go step by step and explore Formula Bar in Power Query Editor:
Go to File on the top left ribbon menu:
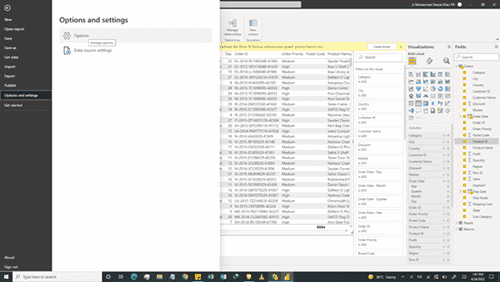
Go to Options and Settings:
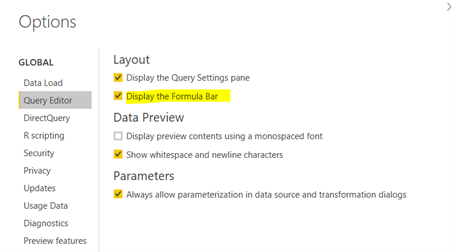
Click the option "Display the Formula Bar" in "Options and Settings".
Now you can see the Formula Bar in the Query Editor.
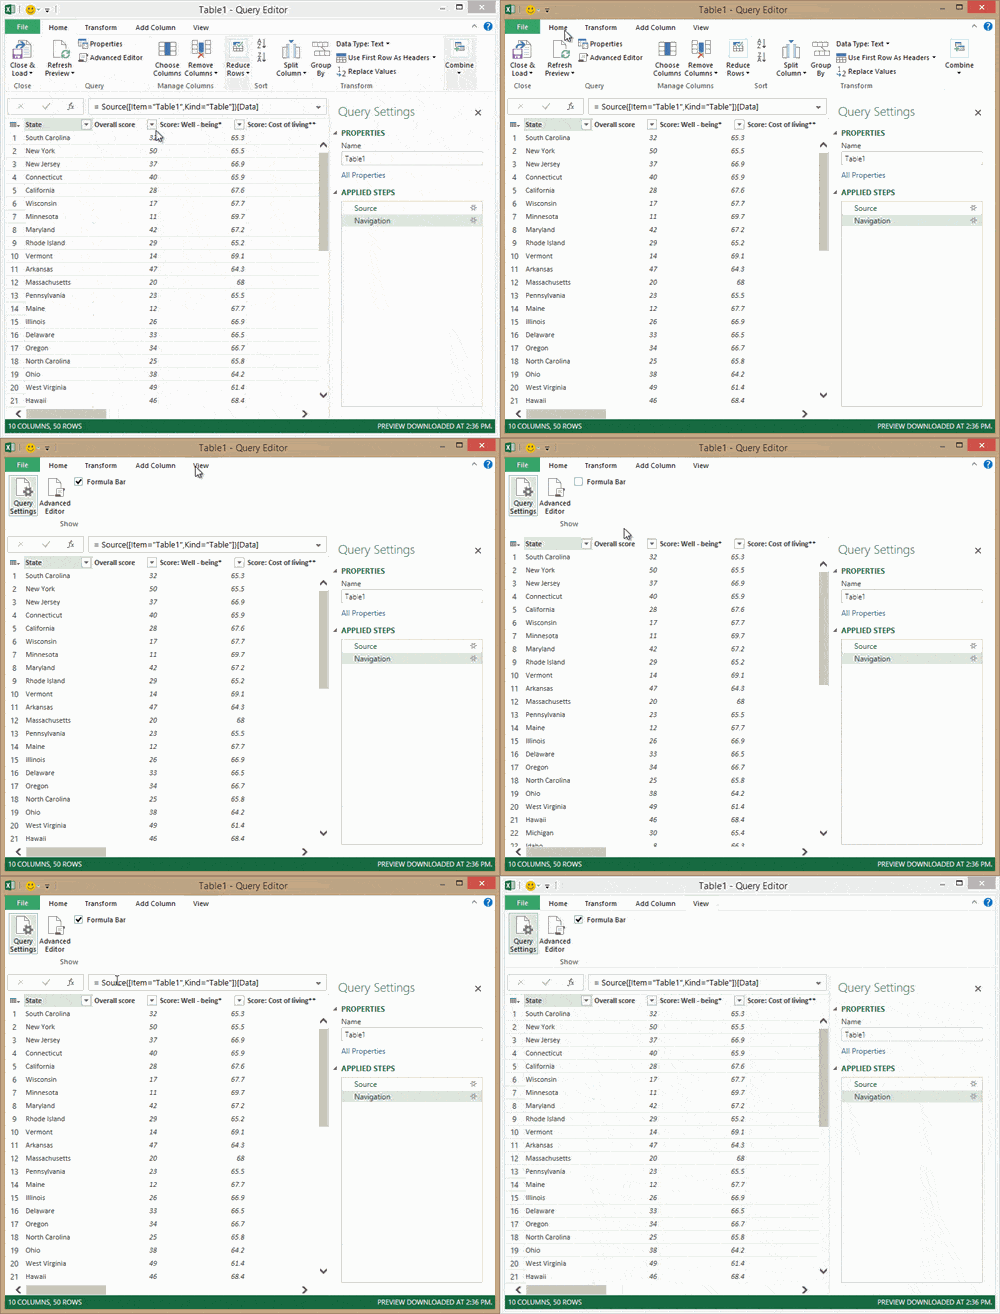
Formulas perform all query transformations in Power Query. A formula is added to the formula bar as you use the Query Editor builders. You may want to add a formula other than those associated with a builder, or you may want to alter an existing formula.

Before we go deeper, we need to know the difference between DAX and M Language.
What Is The Difference Between DAX and M Language?
There are two languages that Microsoft Power BI uses to transform, filter, manage, and visualize data; M language and DAX (Data Analysis Expression).
M language can be considered as a query formula language used in the Power BI Query Editor to prepare data before it can be loaded into the Power BI model. In contrast, DAX is an analytical data calculation language used for in-depth data analysis during the Data View phase.

The measure/column tool additionally provides all the information related to the measure or column, respectively. A DAX expression consists of a formula followed by a measure or a column reference.
How To Add a Formula to a Power BI Query
Queries can be added to formulas in Power BI. When we create a formula, Power Query validates the formula syntax. When we insert or delete an intermediate step in a query, we might potentially break a query. Power Query will display an 'Insert Step' warning when we try to insert a new step.
Let us go through the procedure to add a formula to a query:
- In the query step pane, select the step you want to precede the new step (formula) immediately.
- Click the function or fx icon to the left of the formula bar. A new formula is created in the form = <nameOfTheStepToReference>. For example, = Production.Work.Order.
- Type in the new formula in the format = Class.Function(ReferenceStep[,other-parameters]).
- For instance, you have a table with the column Gender, and you want to add a column with the value "Ms." or "Mr." depending on the person's gender. The formula would be = Table.AddColumn(<ReferencedStep>, "Prefix", each if [Gender] = "F" then "Ms." else "Mr.")

Creating Calculated Column
To create Calculated Columns:
- Right-click on the Table.
- Click on New Column.
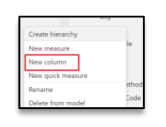
Let's get Product Cost in the Sales Table from the Product Table.
- Type in the following DAX formula in Formula Bar: Product Cost (CC) = RELATED('Product Table'[Product Cost])
Now, Let's Create a Revenue column by multiplying the Quantity Sold by the Sale Price.
- Right-click on the Sales Table.
- Click on New Column.
- Type in the following DAX formula in Formula Bar.
Revenue (CC) = 'Sales Table'[Quantity Sold]*'Sales Table'[Sale Price]
Now let's create a Total Cost column by multiplying Quantity Sold by Product Cost.
- Right-click on the Sales Table.
- Click on New Column.
- Type in the following DAX formula in Formula Bar: Total Cost (CC) = 'Sales Table'[Quantity Sold]*'Sales Table'[Product Cost (CC)]
All three columns, i.e., the Total Cost (CC) column, Revenue (CC) column, and Product Cost (CC) column, have been created, giving values for which row of the Table.
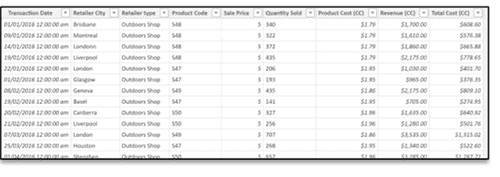
Calculated Columns have a distinct icon, as seen in the screenshot, to differentiate them from other data entities.

How To Edit Power BI Formula
Two ways to change the Power BI formula are firstly using the formula's dialog box and secondly in the formula bar.
Edit a formula using the formula's dialog box
- In the query step pane, right-click the step you want to edit.
- From the context menu, select Edit Settings.
- In the dialog box, edit the formula.
Edit a formula in the formula bar
- In the query step pane, select the step you want to edit.
- In the formula bar, locate and change the parameter values to the values you want.
- Click Refresh.
The Query-Editor appears when you load, edit, or create a new query using Power Query. To view the Query Editor without loading or editing an existing query on the workbook, select From Other Sources >> Blank Query, from the Get External Data section in the Power Query ribbon tab.
Power BI Filter Formula
Creating a Filter on a Table used in a Formula
Power BI allows us to apply filters in formulas that take tables as an input. So instead of entering table names, we can use the FILTER function to define a subset of rows from the Table. That subset can be passed to another function for various operations like custom aggregations.
For example, suppose we have a data table containing order information about resellers, and we like to calculate the formula for sales from each reseller. However, we want to show the sales amount just for the resellers who sold multiple units of high-value products.
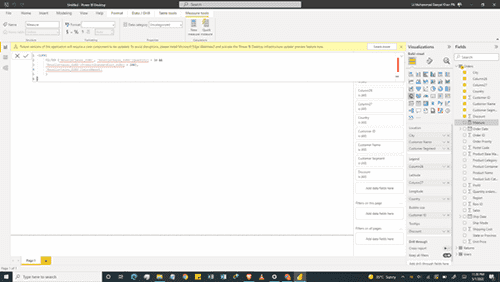
Based on the Power BI DAX sample workbook, using the filter formula, we can create the calculation:
=SUMX(FILTER ('ResellerSales_EURO', 'ResellerSales_EURO'[Quantity] > 10 &&
'ResellerSales_EURO'[ProductStandardCost_EURO] > 200),
'ResellerSales_EURO'[SalesAmount])
Functions that return a table, such as FILTER, will never directly return the rows or Table but will always be embedded in another function.
The FILTER expression is affected by the context where it is used e.g. if we use FILTER in a measure, and the measure is used in a PivotChart or PivotTable, the subset of data returned may be affected by additional filters or Slicers that the user has applied in the PivotTable.
How To Use Replace Function in Power BI?
Replace function in DAX allows us to replace part of a text string, based on the number of characters specified, with another text string. MS Excel has different functions to use with single-byte and double-byte character languages but DAX uses Unicode. Therefore DAX stores all characters as the same length. Replace function is not supported in DirectQuery mode when used in row-level security (RLS) rules or calculated columns.
A typical Replace Function syntax looks like this:
REPLACE(<old_text>, <start_num>, <num_chars>, <new_text>)
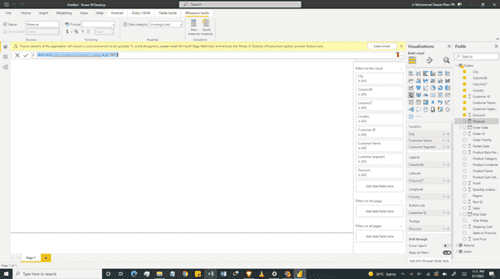
For instance, to create a new calculated column replacing the first two characters of the product code [ProductCode] column, with a new two-letter code, OB, we will use the following formula:
= REPLACE('New Products'[Product Code],1,2,"OB")
How is SUBSTITUTE different from REPLACE?
Substitute Function will replace existing text with new text in a text string. We use the SUBSTITUTE function when we want to replace specific text in a text string. We use the REPLACE function when we want to replace any text of variable length which occurs in a specific location in a string of text. SUBSTITUTE-function is case-sensitive i.e. if case does not match between text and old_text, SUBSTITUTE will not replace the given text. It is not supported in DirectQuery mode when used in row-level security (RLS) rules or calculated columns.
The syntax appears like this:
SUBSTITUTE(<text>, <old_text>, <new_text>, <instance_num>)
To make a copy of the column [Product Code] to substitute the new product code NW for the old product code PA when it occurs in the column, we will use the following code:
= SUBSTITUTE([Product Code], "NW", "PA")
Conclusion
Power BI is one of the best tools in the Data Science and Analytics industry. If you want to be the best you need hands-on experience with Power BI. Attend one of our many courses to become acquainted. Courses range from beginner to DAX and are offered remotely across Asia.

 Australia
 New Zealand
 Singapore
 Hong Kong
 Philippines
 Thailand
 Indonesia


