
 Australia
 Singapore
 Hong Kong
 Malaysia
 Philippines
 Thailand
 Indonesia

Excel and Power BI are both incredibly useful data science tools and if you are starting out your career in data science, they will give you a solid foundation. You can get amazing interactive dynamic reports with Power BI. However, at times you do need static reports that require copying data from Power BI to MS Excel. This can be a confusing process, especially for a beginner.
This blog post will answer the common question: "how do you copy data from Power BI to Excel?”
Excel & Power BI
Power BI is a fantastic business intelligence tool that can easily create dynamic and appealing business reports and dashboards.
Excel is a state-of-the-art spreadsheet application that is quite versatile in usage. Excel also helps create interactive dashboards using slicers and tables.
The key advantage of Excel is that it can do more than just create reports. For example, we can create a loan schedule in a flexible grid that takes inputs and provides complicated calculations as outputs. Hence, Excel is also beneficial for financial modelling and forecasting.
Power BI and Excel both use Power Query and Power Pivot. We can integrate across Power BI and Excel, for example by analyzing Power BI in excel, copying data from Power BI to Excel, or Publishing from Excel to Power BI.
To email Microsoft Excel files to your team, there’s always a risk that the shared information may become outdated which can be avoided with shared platforms such as OneDrive, SharePoint, or Microsoft Teams. MS Excel and Power BI work great together, especially when using Excel for data crunching and Power BI for presentation and sharing.
Exporting your data from a Power BI report
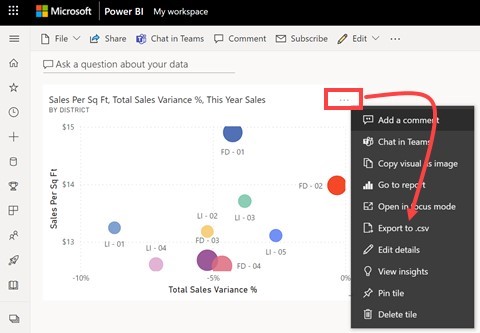
1. In the Power BI service, open the dashboard and select the tile containing a visual.
2. Open more options dropdown from the upper right corner of the tile and click on Export to .csv.
3. A warning appears if the tile was pinned from a report with a sensitivity label, as shown below. Prior to export, consider the sensitivity of the content.
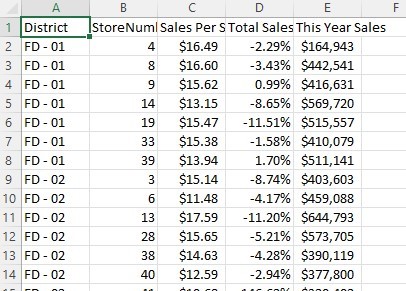
4. Power BI exports the data to a comma-separated variable (.csv) file. The export to csv file will be filtered if you've filtered the visualization. The export is saved to your local Downloads folder by default.
5. Open the file (.csv) in Excel.
To export from Power BI online
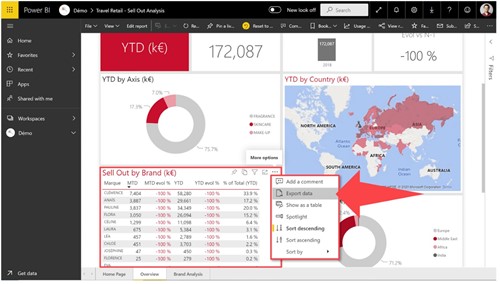
Open app.powerbi.com and choose a report you want to export. You can see the "…” options symbol at the top right of the screen. Click that button and then click “Export Data”.
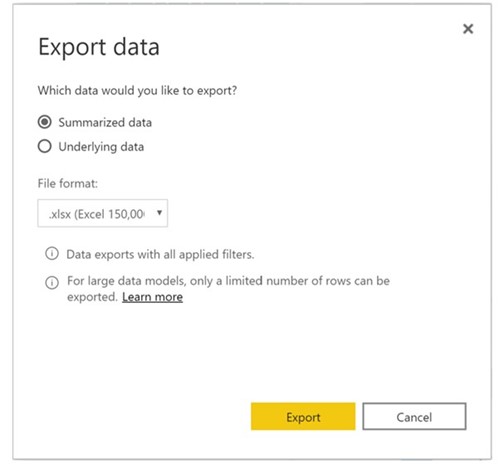
This can be exported as .XLSX or .CSV format. You will have access only to the data filtered by the “Summarized data” view. You can export underlying data or unfiltered data by choosing “Underlying data”, depending on your rights.
Now you can edit the data or graphs directly in MS Excel. This however has certain limitations:
- Data can be exported from one visual at a time, in a new CSV.
- Data cannot be updated in Excel as the Power BI report changes.
- Data relevant to PBI visual can be exported but we cannot extract a table, because the data and the data model cannot be viewed in the published version.
So, to export a table from Power BI Desktop to Excel, go to the “Data” view and select a table. Right-click and click “Copy” for one column, or “Copy Table” for the entire table. Then paste the data into an MS Excel file in order to retrieve it.
Using “Analyze in Excel” To export large data sets from Power BI to MS Excel
This method can handle complete data models and allows us to change a large amount of data.
Here is how we use Analyze in Excel Function in Power BI to export large datasets to MS Excel:
- Go to app.powerbi.com, connect to your account and open the report containing the data set you want to export
- Click “(…)” option to the far right of the ribbon above your report
- Select “Analyze in Excel”

This will download an Excel file in .ODC format. ODC is an extension that is stored using HTML and XML versions. From here on we can create PivotTables, visuals, etc. directly in Excel from the data derived from the Power BI data cube.
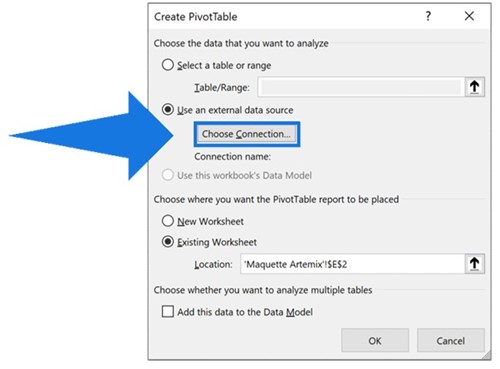
To create a PivotTable in MS Excel file, go to “Insert” then “PivotTable” tab and select “Use an external data source”. Then click choose connection to connect to the desired data cube.
Proceed to the “Data” tab and select “Refresh All” to refresh your data from the Power BI report.
This is a semi-dynamic method but it has the following limits:
- It generates a new file, with an .ODC extension which is different from what Microsoft recommends i.e. .xlsx.
- We must create measurements from data models since we cannot create them in a PivotTable.
Get data from within Excel
We can get data from within MS Excel by following these steps:
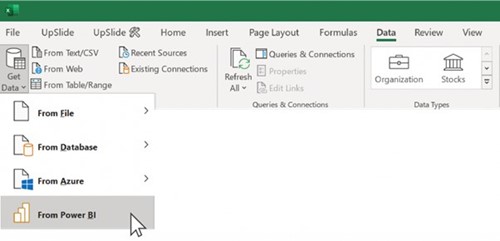
- Go to Excel “Data” tab and click “Get Data”
- In the drop-down menu, Click “From Power BI”
- To create a PivotTable in Excel, select a dataset from the right-hand pane.
- Choose the fields from the “PivotTable Field List” that you want to display
This is not very efficient because selecting fields from a PivotTable Field List makes it difficult to visualize and understand the data set, especially for someone who did not create the Power BI dashboard. Clicking through all the PivotTable fields to create the table in MS Excel is very time-intensive.
Admin and designer controls for exporting
As a Power BI report designer, you can set following rules for your reports:
- Allow end users to export summarized data from Power BI Report Server or PBI service
- Allow end users to export summarized and underlying data from the Power BI report server or service.
- Deny end users to export any kind of data from the Report Server Or service. Report designers should revisit their old reports and manually reset the option to export as required.
Here is how we set these options:
1. Open Power BI Desktop and select file, then options and settings and then options from the upper left corner.
2. Under the CURRENT FILE option, click Report settings.
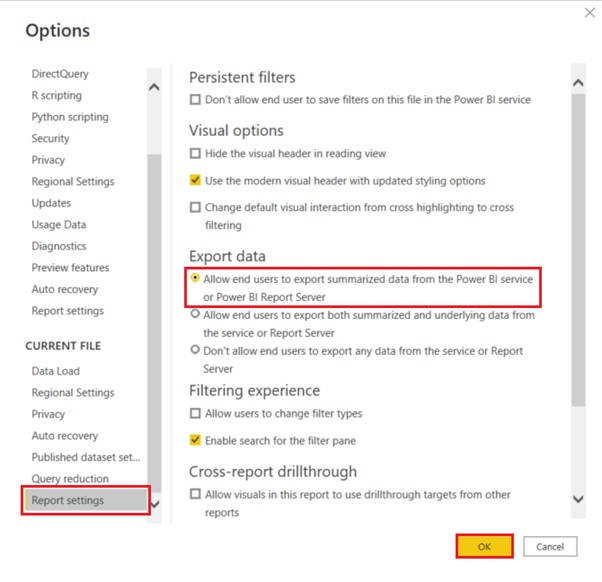
3. Select desired policy from the Export data section. We can change this setting in Power BI service as well. The admin settings will override the export data settings if the archive BI admin portal settings are in conflict with report settings for export data.
Considerations and limitations
When exporting from Excel, there are many considerations and limitations. Report Designers and PBI admins may disable this feature for individuals or for organizations to secure private data. So, when you are not able to do this, make sure you contact your administrator. They may have purposefully disabled certain features and may make them available for you as required.
Sometimes due to permissions, data contents, data type, visual type, how the designer named the fields, etc., certain features other than Export to Excel, may not be available. Some other limitations/ considerations are:
- Download Speed of the generated workbook can vary depending on network bandwidth when exporting data to Excel.
- Power BI desktop and service can export 30,000 rows max to .csv file while for .xlsx it is 150,000 (which may be lower than 150,000 based on query limits and visual types).
- Export using Underlying data won't work for:
- Version before 2016.
- Tables in the model without a unique key.
- Disabled feature by admin.
- The case where we enable the “show items with no data” option for the visualization exported by Power BI.
- When using DirectQuery, the maximum exportable uncompressed data is 16-MB. This may lead you to unintentionally export less than the maximum number of rows of 150,000. This is likely if:
- There are too many columns. Reducing the number of columns and re-exporting may help.
- Data is there that is not easily compressed.
- Various factors leading to an increase in file size and a decrease in the number of rows that are exportable Power BI.
- Power BI will only export data for the first table if your visualization uses two or more data tables, and no active relationship exists for those tables in the data model.
- Currently R-visuals and Power BI custom visuals are not supported.
- Text in Excel may not display properly if it has Unicode characters in the .csv file. A common workaround to this is to open the file in Excel and import the .csv. To import the file into Microsoft Excel:
- Open MS Excel file and then go to the Data tab.
- Select the “external data” option then “From text”.
- Go to the folder where the file is stored locally and select your .csv.
- Certain characters will be escaped with a leading ' to prevent script execution when opened in Excel when exporting to .csv. This occurs when:
- In your data model, the column is defined as type "text"
- The first character of your text is one of these: =, @, +, -
- Exported data won't preserve this formatting in Excel in scenarios where a dynamic format string is applied to a measure.
- Visual-specific formatting such as percent of grand total for a measure isn't preserved in Excel.
So we have learned some ways to copy data from Power BI to MS Excel, their advantages and limitations. Attend on of our courses to learn more about Excel and Power BI.


