
 Australia
 Singapore
 Hong Kong
 Malaysia
 Philippines
 Thailand
 Indonesia

Microsoft’s Power BI is a data visualisation software that is being adopted by some of the world’s largest companies. No matter your profession, being able to visualise data in an effective manner is necessary.
While the phrase ‘business intelligence’ may suggest that you must be working at a business, any data-rich organisation or industry can reap the benefits of implementing Power BI.
Education & Power BI
At Nexacu, we train education professionals, including both teachers and those in administration roles. Increasingly, the education industry is turning to Power BI for actionable insights.
Given the amount of data created and collected by schools, there are multiple angles for the use of Power BI. As education professionals, it’s time to start asking yourself – How can I use Power BI in the academe?
Take this as an example.
School principals use Power BI to do the following:
(a) Study demographic changes in the school's catchment area
(b) Monitor student performance for example as a cohort ages through the various grades
(c) Monitor the progress of students who require more support in academics through a focused approach
Aside from principals, teachers will also benefit from Power BI through the aspects discussed below.
Student Level
Schools are using Power BI to create student ‘profiles’. These profiles contain information such as attendance, marks, subjects enroled in, and teacher feedback. These profiles/dashboards can be a useful snapshot of a student as well as an effective tool at parent-teacher conferences. Several schools have been reported to be considering the implementation of student profiles in the form of dashboards.
A consistently cited reason to use Power BI is the customisability. While excel is also customisable, it can be difficult to visualise copious amounts of data through spreadsheets. In comparison, Power BI has all the intelligence and customisability of Excel but can visualise data more effectively.
Therefore, while stats such as marks or attendance can be included, you can customise the student profile to include important details. This could include:
- Whether the student has made progress in a subject
- Whether the students have underlying behavioural issues
- Whether they excel more in a particular area of study
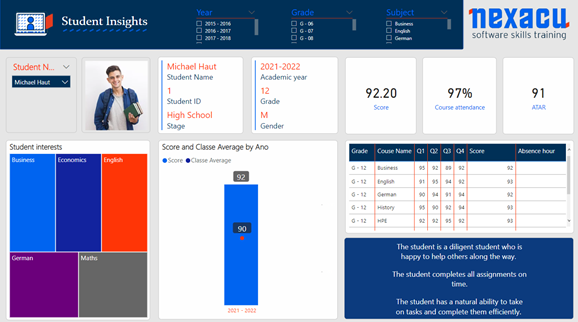
These profiles aren’t just an asset to a teacher – they are also a useful tool for giving parents and colleagues an ‘at-a-glance’ look at a student. The interface is also intuitive and user-friendly with simple ‘point and click' functionality on dashboards. With Power BI, you can drill down into data where needed, or filter/sort data to answer more detailed questions.
An underacknowledged benefit of Power BI is its dedicated user community. There are many blogs, YouTube pages, and websites relating to user experiences and help. The prevalence of Power BI within the British school system has even prompted the creation of a dedicated ‘Power BI for Schools’ Facebook page.
Teachers can truly benefit from these resources especially when they need to learn about the generous features Power BI offers.
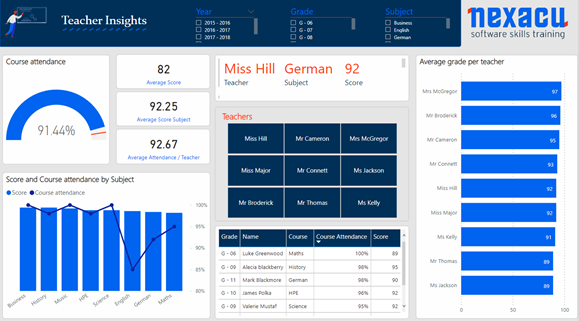
Class Level
While the individual student profiles are helpful, an entire class dashboard would be useful for teachers to assess their performance and streamline their strategy going forward.
Given how easily Power BI connects to data sources, teachers in the UK have prescribed an online test to their students and then have that data exported to Power BI. Power BI also has powerful intelligence and data analysis capabilities. The data from the online test is used to group students based on their strengths and learning needs; this leads to much more effective teaching.
Class-level dashboards could contain all sorts of information, including the average scores, the average scores in comparison to other classes, and attendance among any information that can be visualised.
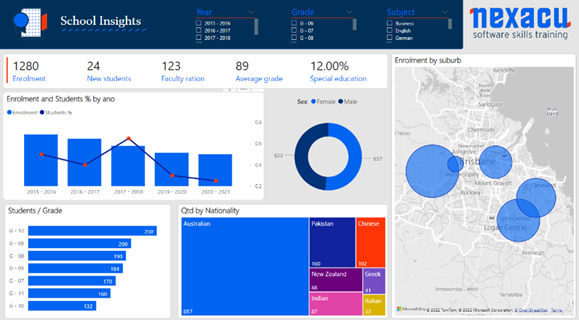
School Level
The job of a school is to educate and nurture its students. While their marks are a vital part of that, there are many other aspects of schooling life that need to be monitored to ensure students are given the best environment and the school is being run efficiently. Things such as maintenance, finances, IT, hiring, and can be visualised to draw insights.
As previously mentioned, Power BI has powerful intelligence and data analytic capabilities. This could be of use for a number of things, and some schools have used it to detect patterns in absences, such as how punctuality is related to the distance between a student's house and the school.
Another powerful tool within Power BI is the data analysis function. Power BI can be used to look for patterns using built-in intelligence. This feature has a multitude of uses, with some listed below.
- Behavioural Incidents - do they correlate to a particular event or year group?
- Does a particular teacher perform better than others? Is this then related to the year level or subject they are teaching? Is there a study area that lags?
- The efficiency of using a timetable
Department Level
Another aspect of Power BI we are yet to touch on is the natural language capabilities. In large datasets uploaded to Power BI, you can search using natural language, and the application will pull up the data it feels is relevant.
Ray Fleming used data found on the Queensland Open Data website to demonstrate this. After uploading data from the Queensland Open Data for education, he searched the data in several different ways.
He also demonstrated how you can manipulate a visual – Power BI will show you what it ‘thinks’ is the most appropriate visualisation. Sometimes it can get it wrong, or you just want the data displayed differently. This is a quick and easy fix.
A benefit of the system working in such a way is that it cuts down on reporting time. Traditional methods will see a time-consuming back and forth with hours or even days between versions before you can find the data you need. This also places pressure on the data analyst to turn out reports at a quicker rate, instead of taking time to delve into what the data is saying. Power BI cuts out the middleman for quicker enquiries and gives employees the power to retrieve data faster and more efficiently.
There is incredible power in data analysis. When a school district in the US first implemented Power BI, it’s graduation rate was a “shameful” 55%. Using the backlog of data, risk factors for leaving school were recognised and flagged. The superintendent then used Power BI to recognise at-risk students and intervene before they left school. Every morning, the application would send a colour-coded report to the principal that outlined which students required attention.
Eventually, the district obtained a graduation rate of 82%.
Conclusion
A takeaway from this article should be that Power BI education dashboards can be used in many ways depending on your needs. The examples used here are just ideas, learning Power BI will help you realise how you can get the most out of it.
We often spruik the benefits of Power BI, but harnessing data like this can be truly life-changing. Had the school district not implemented Power BI, they never would have been able to intervene early and change the lives of their students. While it is an incredible story, the use of Power BI doesn’t need to be on this level to be useful. The education industry stands in good stead to make use of the data it collects.
Educational sectors and agencies would benefit from knowing that we offer Power BI training courses from the beginner to advanced level as well as a DAX course.


