What to Expect from a Canva Course: A Step-by-Step Guide
Curious about Canva courses? This step-by-step guide shows you what to expect, from mastering design tools to creating eye-catching visuals with ease.

Curious about Canva courses? This step-by-step guide shows you what to expect, from mastering design tools to creating eye-catching visuals with ease.

Curious about Canva courses? This step-by-step guide shows you what to expect, from mastering design tools to creating eye-catching visuals with ease.

AI tools like ChatGPT and Microsoft Copilot can help your business become more efficient and productive. But to make the most of these platforms, you need to know how to write a good prompt. This blog will teach you how to do that and how Nexacu can empower you to master this essential skill.

While many businesses use ChatGPT for basic tasks like generating emails and social media posts, did you know that the tool can do so much more? This blog will identify five powerful use cases for your organization.

AI tools like ChatGPT and Microsoft Copilot have recently been making waves beyond generating high-quality data, text, and images. Businesses are discovering how these platforms can be leveraged to significantly improve their productivity and efficiency.

Did you know that people lose 219 hours per year doing repetitive tasks, according to a study? Copilot for Microsoft 365 can help you take back some of that lost time, thanks to its AI-powered features. This blog post will explore Copilot's various features and how it can revolutionize the way you work within Microsoft 365.

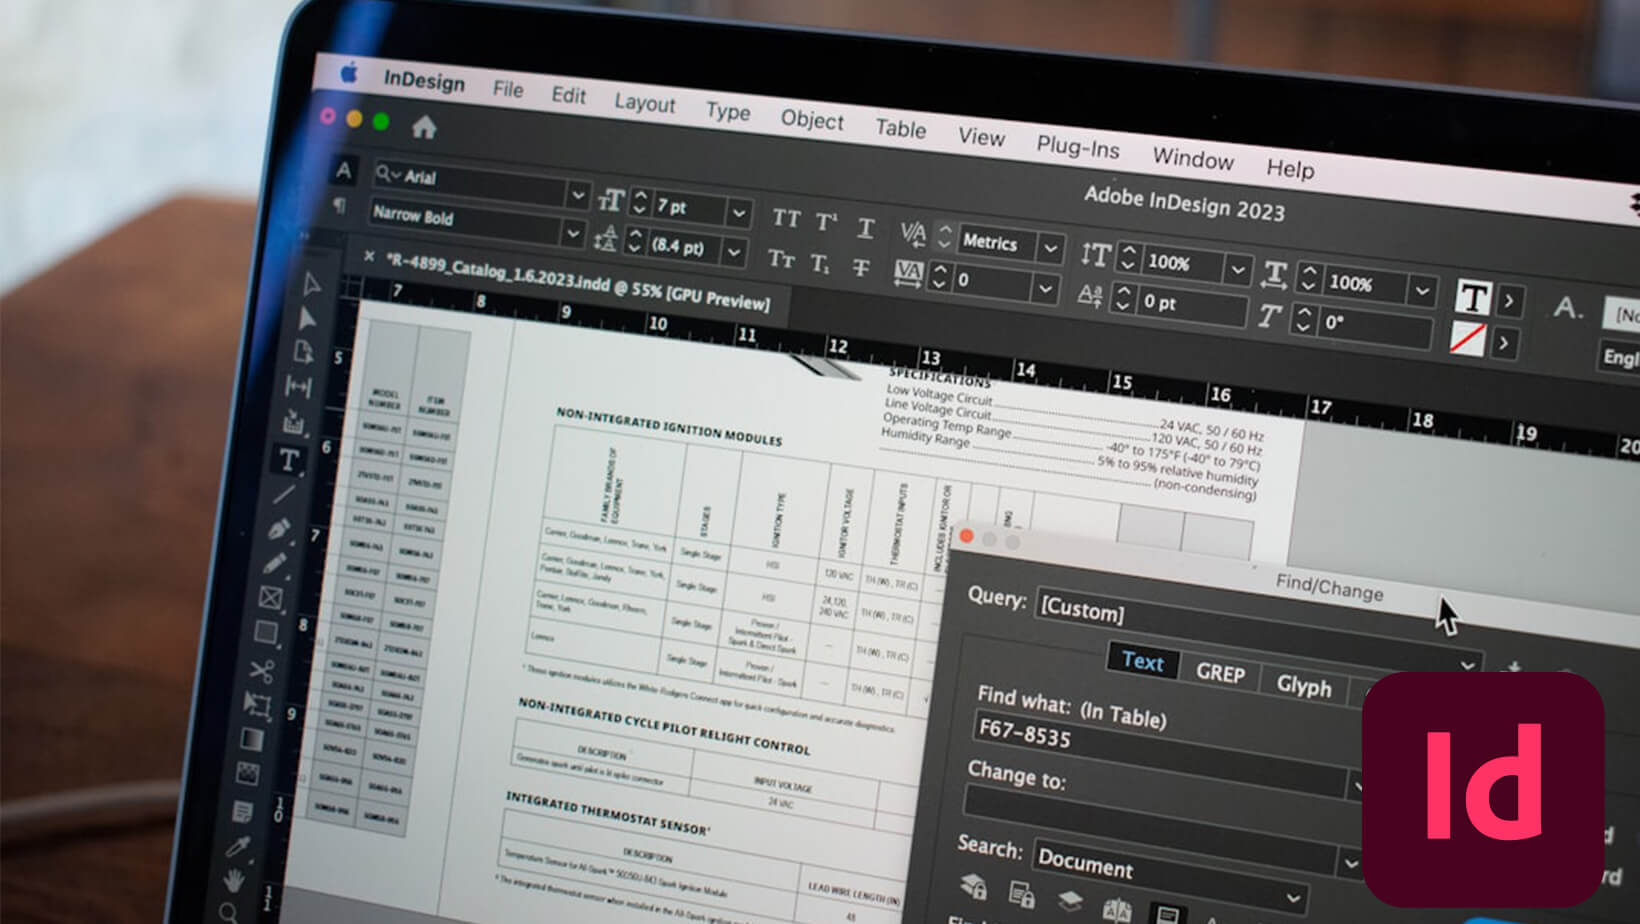
Unlock your creative potential with Nexacu’s Adobe InDesign courses, perfect for all skill levels. Master professional-quality layouts, advanced typography, and interactive features to elevate your design skills.

Understand prompt engineering and how it can help you get the most out of ChatGPT. In this blog, you will learn how prompt engineering can help various business sectors, the best practices when creating prompts, and the effectiveness of a specific prompt compared to a generic one.

Artificial intelligence is being used globally to streamline operations and innovate better. As such, business leaders must learn to harness the technology. This blog will list the benefits of AI training for leaders and how they can take advantage of this burgeoning technology.

AI is now revolutionizing the way many people work as it can automate repetitive tasks and analyse large datasets. But did you know that this technology can also improve your communication skills at work?

Artificial intelligence (AI) is one of the most important technologies that we have today. In this blog, you will learn its benefits for businesses and why managers should leverage AI tools like ChatGPT and Microsoft Copilot to improve their team’s productivity.

Learn all about AI and why small businesses need to leverage it to stand out from the competition. This blog will list down the ways AI can help in every aspect of business operations, and what to know before you implement the technology.

Microsoft’s latest survey revealed that just by dabbling in AI, users save about 11 minutes a day. And after 11 weeks, its impact on work becomes genuinely transformative. Learn more about these transformative benefits on productivity, work enjoyment, work-life balance, and meetings.

Explore the transformative role of Power BI in banking, enhancing data analysis, financial management, and customer engagement strategies.

Master the art of newsletter creation with tips on crafting subject lines, engaging content, and design that captivates and connects with your audience.

Discover Adobe XD, the ultimate design tool for creating stunning web and mobile user experiences. Learn about its key features, collaboration, and use cases.

Master the essentials of JavaScript with our beginner’s guide, exploring its role in web development and how it makes websites interactive.

Master Adobe Apps with Nexacu's practical courses covering Photoshop, Illustrator, and more. Flexible face-to-face and remote learning options boost your skills and job prospects.

Discover how to create engaging email newsletters quickly with our guide, featuring design tips, compelling content strategies, and success metrics.

Master JavaScript for web design with Nexacu’s courses to create dynamic, responsive, and interactive websites that captivate users.

Become a skilled WordPress developer. Learn PHP, JavaScript, HTML, CSS, and join a vibrant community to build and manage dynamic websites.