Australia
 New Zealand
 Singapore
 Hong Kong
 Malaysia
 Philippines
 Indonesia

Introduction – What is Power BI?
Power BI is a synchronous collection of services, apps, and connectors. They combine to turn your unrelated data sources into valuable, visually immersive, and interactive insights. It is an essential tool in a data analysts toolkit, and today we'll learn about Power BI training for beginners.
Power BI DAX
Data Analysis Expressions collect various constants, functions, and operators to select BI and data visualization tools. It is called function language because the entire code resides inside the parts.
DAX allows users to create new information from data that already exists in your model. It can be manipulated to help define the custom calculations used in calculated columns and fields. It also helps in performing dynamic aggregation and working with relational data. DAX allows flexibility for data models but can get complicated. However, it has a steep learning curve.
The Amazing Power BI
Power BI is versatile and loaded with features; professionals in many different roles use it, including:
- Administrators
- Professionals (accountants, sales professionals, marketers)
- Designers
- Developers
But any role at any company could find a valid and valuable use of Power BI. The features available to Power BI users ensure that it is a useful tool for all.
Power BI facilitates intelligent decision-making, reducing the likelihood of failure and mitigating risks. The data processed by BU are available for interaction 24/7, anywhere you have mobile access. This convenient feature allows users to pull, process, and share real-time data anytime, anywhere. It is easy to use, gives access to over 70 data connectors, and allows data sharing and collaboration.
Because of the existence of never-before-seen levels of data today, Power BI is a powerful tool to make informed decisions. Harness the power of your data through interactive and visually engaging graphs produced by Power BI.
How to Learn Power BI
Before you jump into anything, watching videos of people using Power BI and having a look through the application yourself is a good way to get a first feel for the language and structure of the program. Once you feel you have a decent grounding, look at the techniques below to further your skills.
Here are some ways to improve your Power BI skills:
Microsoft's documentation and webinars
Microsoft keeps an incredibly extensive library of both written and visual resources to aid in your learning of Power BI. This is accessible through their website and major video streaming platforms such as youtube.
Official Power BI online community and developer's blog
The best way to learn about Power BI is from those who have been in your shoes. Power BI is known for having an incredible community of like-minded individuals willing to help one another in their learning journeys.
Nexacu provides fantastic Power BI Courses for beginners and advanced audiences. Check out our Microsoft Power BI training for beginners here.
Last (but not least!) Nexacu offers four different Power BI courses which are a great resource. Our trainers are knowledgeable and patient; and the four levels of courses allows you to slowly build up your knowledge for the best learning outcomes.
How to Use Power BI
Power BI consists of:
Power BI Desktop
It merges state-of-the-art interactive visualizations with industry-leading data queries and modeling. It allows us to create and publish reports to Power BI with timely critical insights, anytime, anywhere.
Power BI Service
The Microsoft Power BI service (app.powerbi.com) or Power BI online is SaaS (Software as a Service) or cloud. Dashboards and reports connect to datasets that bring all of the relevant data together in one place. Dashboards display tiles; we can select to open reports for further exploration.
Mobile apps
BI is available on mobile phones (Android and IOS). Power BI offers a set of applications for iOS, Android, and Windows. We can connect to and interact with the cloud and on-premises data. We can also use Power BI Desktop, the service, and the mobile apps to create, share, and consume business insights. Read What is Power BI for an overview.
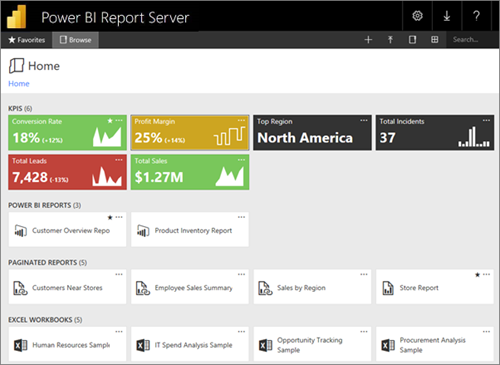
Power BI Report Server
Users can connect to the desired sources and build reports using the Power BI Desktop. When the report is complete, users publish it to the Power BI service, allowing end-users to view and interact with the information. You can use the Power BI Report Server if you want to keep the privacy of reports to company personnel. After you create your Power BI reports using Desktop, you can publish them to an on-premises report server.
Components of Power BI
Here are some components of Power BI:
Power Query transforms the data enabling us to discover, connect, combine, and refine data sources to meet our analysis needs. It is downloadable as an add-in for Excel or used as part of the Power BI Desktop.
Power Pivot is a data modeling method that helps create data models, establish relationships, and make calculations. It uses DAX language to model simple and complex data.
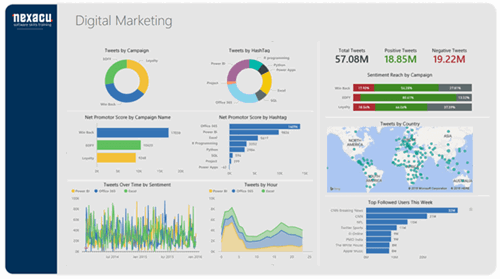
Power View is available in MS Excel, PowerBI, Sharepoint, and SQL Server. It allows you to create interactive charts, graphs, maps, and other visuals that bring your data to life. It also connects data sources and filters data for each data visualization element or the entire report.
MS Power Map works with Bing maps to get 3D visualization based on information on latitude, longitude, country, state, city, and street address.
Conclusion
Power BI is the best data analytics tool if you are starting or upgrading your career. Check out our Power BI beginner training course to master basics; then transition to our intermediate and advanced courses to complete your training. Nexacu also offers certifications to fast track your learning.