Australia
 New Zealand
 Singapore
 Hong Kong
 Malaysia
 Philippines
 Indonesia

What is Power BI
Microsoft Power BI is a fantastic interactive data visualisation software product used for data analytics, business intelligence, and visualisation. It is a part of the Microsoft Power Platform, and it comes with cross-platform connectivity and a multitude of services.
Power BI Dashboard vs Report
Let us first try to understand the difference between a Power BI Dashboard and Power BI Report.
A Power BI dashboard or a canvas is a single page that tells a story with the help of visualisations. A well-designed dashboard is limited to one page, containing only the highlights of the story. You can view related reports for further details. They are available in the Power BI service, not on Power BI Desktop.
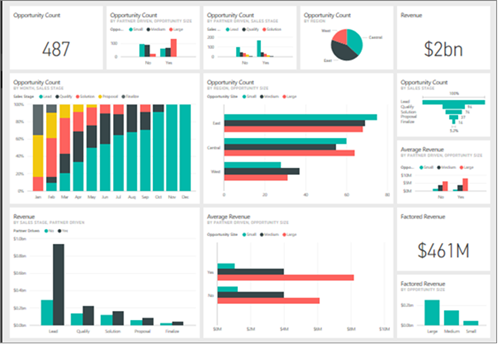
A Power BI report is a multi-perspective view of a dataset with visualisations representing various findings and insights. It can have a single visualisation or pages full of them. Power BI Report Builder is a tool for authoring paginated reports to publish to the Power BI service. When we design a paginated report, we create a report definition specifying what data to retrieve, where to get it, and how to display it.
Creating Dashboard from Reports
There are various ways to create a dashboard. For example, we can create a dashboard from a report (like pinning visuals and images from reports), from scratch, from a dataset, or by duplicating an existing dashboard. Here is a step-by-step procedure on how to use integrated data from report to Dashboard in Power BI:
1. Import a Dataset with a Report
Import one of the Power BI sample datasets to create the new dashboard. The sample used is an Excel workbook with two Power View sheets. Power BI adds a dataset and a report to the workspace when we import the workbook. The report is automatically created from the Power View sheets.
1. Download the Procurement Analysis sample ( MS Excel file).
2. Open the Power BI service on the browser (app.powerbi.com).
3. Select My Workspace and then Click New, then Dataset.
4. Select Excel.
5. Click Browse this device (very bottom left of the dialog).
6. Navigate to the location Procurement Analysis sample Excel file location. Select the file and Connect. Then, choose to build the report from scratch.
How to View the Similar Report through Sample Report Online
1. Go to Learn from the navigation pane.
2. Go to Sample Reports and search for Procurement Analysis Sample. This will open a sample report.
3. Click the File tab on the top ribbon then click Save As Report in your name.
2. Open the Report and Pin Tiles to your Dashboard
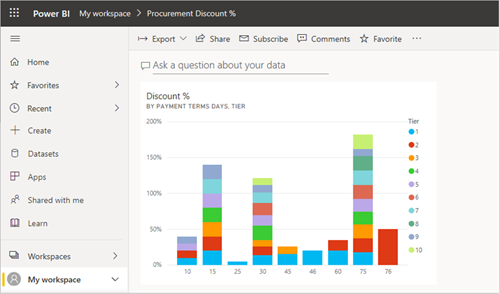
1. Within the same workspace, select Procurement Analysis Sample report and open it. The report will open in Reading view. It will have two tabs on the left i.e. Discount Analysis and Spend Overview. Each tab represents a page of the report
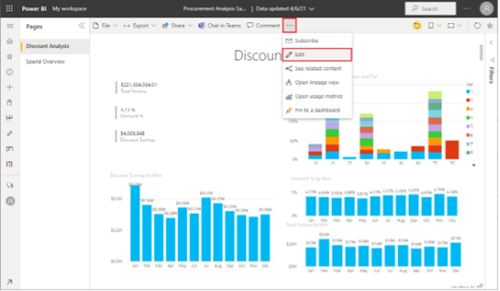
2. Select More Options and click Edit to open the report in the Editing view.
3. Hover over to the part of the visualisation to reveal the options available. Select the pin icon to add a visualisation to a dashboard
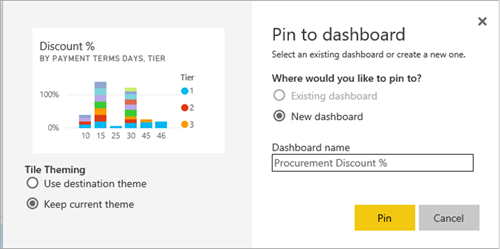
4. Select the option for a new dashboard and give it a name.
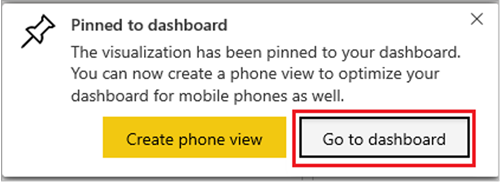
5. On selecting Pin, Power BI creates the new dashboard in the current workspace. After the Pinned to dashboard message appears, click Go to Dashboard. When prompted to save the report, click Save.
6. Power BI opens the new dashboard with one tile i.e. the visualisation we pinned.
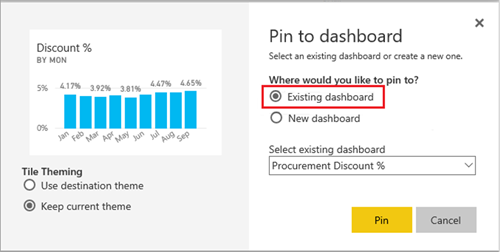
7. Select the tile to return to the report. Pin some more tiles to the new dashboard. When the Pin to dashboard window appears, click Existing dashboard.
8. Pin an entire report page to the dashboard.
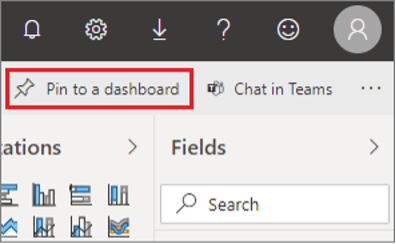
a. We can also pin an entire report page as a live tile. In the report editor, click the Spend Overview tab to open the second page of the report.

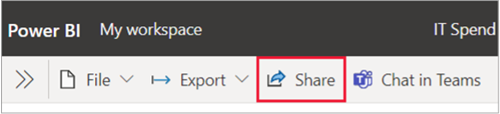
b. We require all of the visuals in the report on the dashboard. On the upper-right corner of the menu, click Pin to a dashboard. On a dashboard, live page tiles will get updated when the page is refreshed.
c. When the Pin to dashboard window displays, click Existing Dashboard.
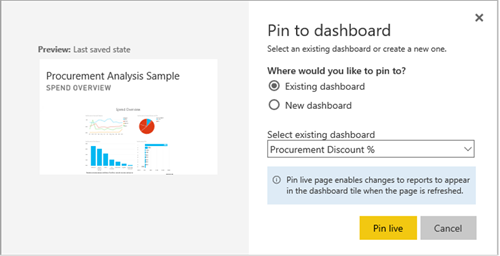
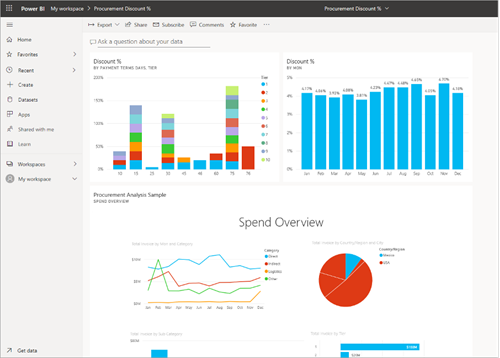
d. When the Success message appears, click Go to Dashboard. The tiles pinned from the report will be visible there. In the example figure below, two tiles from page one of the report are pinned and one live tile, which is page two of the report.
e. You can also create dashboards from multiple reports this way.
3. Share Power BI Reports and Dashboards
Sharing allows us to give people access to our reports and dashboards in the Power BI service. People you share it with can view it and interact with it, but cannot edit it. They see the same data in the reports and dashboards. They also get access to the entire underlying dataset, unless row-level security (RLS) is applied. They can reshare with their coworkers if we allow them to.
The Power BI service allows the collaboration and distribution of reports and dashboards. Learn ways to collaborate and share in Power BI to see which way works best for various circumstances.
Conclusion
So now we know how to create PowerBI Dashboard from a report. This skill is an important asset and an integral part of your Data Science arsenal.
Feel free to check out our Power BI courses on our website, from Beginner to DAX, until the Certification stage.