Australia
 New Zealand
 Singapore
 Hong Kong
 Malaysia
 Philippines
 Indonesia
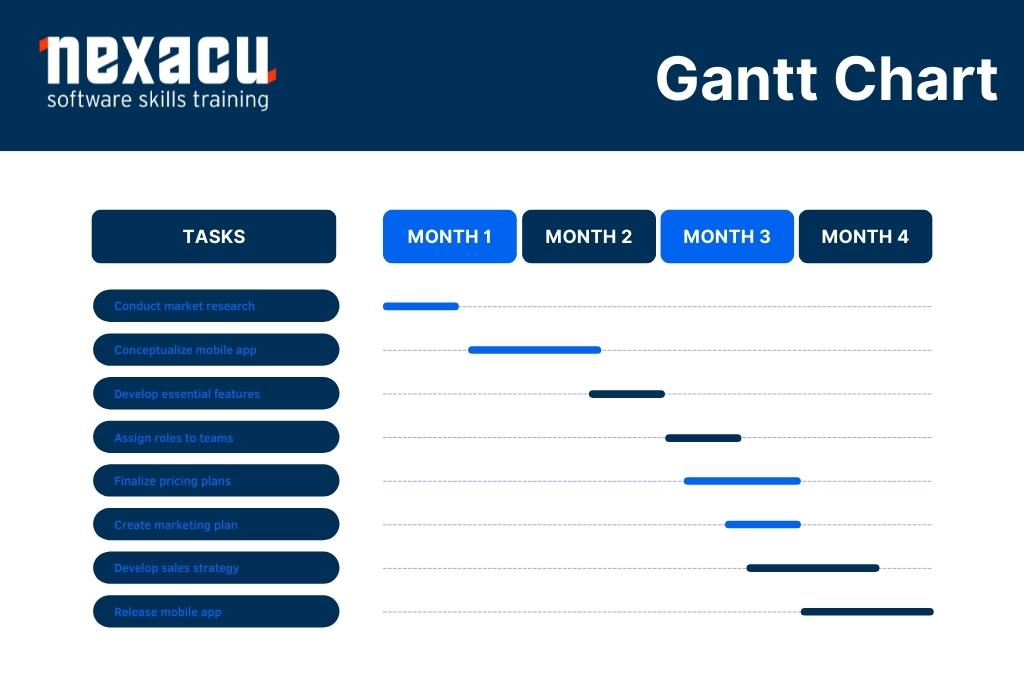
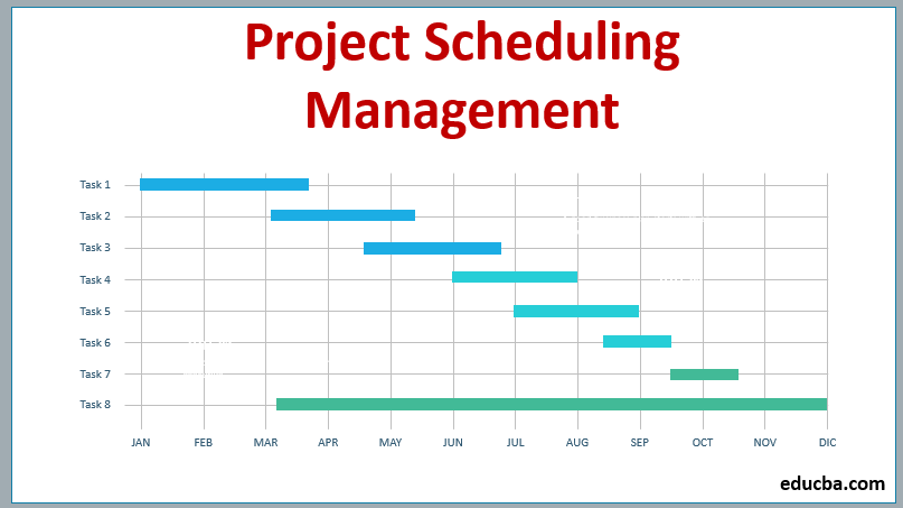
The Gantt chart is one of the most powerful Project Management tools used to show activities (tasks, events) displayed against a timeline (i.e. what activities need to be done and when).
The left side of the chart shows a list of the activities, and on the right side is a timescale with the taskbars. Every activity is represented by a bar; the position and length of the bar show the starting date, duration, and ending date of the concerned activity. We can see:
- What the activities are;
- When an activity begins and ends;
- How long each activity is scheduled to last;
- Where the activities have overlaps with or delays between each other, and by how much; and
- The beginning and end dates of the whole project.
How to Create a Gantt Chart
Gantt charts can be made manually, but it would require lengths of paper, pencils, erasers, and sharpeners. It’s a good thing that technology has made this task so easy for us! On computers, Gantt charts are created with the help of project management information system (PMIS) applications, like Primavera® Project Manager, Microsoft Project®, MindView®, etc.
Typically. meetings are held with the project team leaders to identify activities and create schedules. The schedule can be as detailed or as summarised as required, but it does need to contain enough activities to ensure compliance with the 100% rule. Here are the seven steps for making an effective Gantt Chart:
7 Steps to Make a Gantt Chart in Microsoft Project
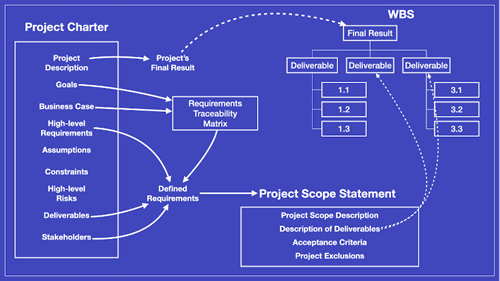
1. Review Scope Baseline
Here we will discuss the scope of the work. The end goal and the timeline must be clarified. The scope baseline must address 100% of the project scope. A scope baseline has primarily three components:
- Scope Statement
- Work Break Down Structure
- WBS Dictionary
2. Configure
Configure the Project Management Software to reflect the organisation's working environment (such as working days and hours). Create calendars for the Project default and custom calendars for specific Activities if needed.
3. Create Activities
The project team now breaks down WBS work into activities through the decomposition process. Rules are set for creating scheduled activities (same as WBS work packages). Final schedules have to be effective and efficient; there should not be too few or too many activities. The team must identify deadlines and milestones during the decomposition of the project.
As a general guide, an activity should be small enough that the Project Manager can easily determine the Duration of the Activity and what Resources are needed to complete it.
Activities are then grouped into Phases or Stages known as Summary Tasks.
4. Estimated Duration
We also have to calculate how long each activity lasts. The difference between the start and end time of the activity of the project is called the duration. We can use resource estimation methods to estimate the duration of an event while identifying constraints, limitations, or restrictions on activity.
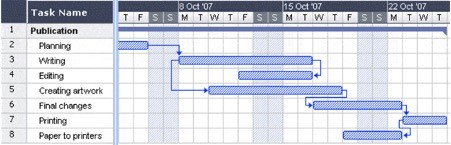
Dependencies in a Gantt Chart (source)
5. Sequence Activities
All activities are interrelated, in one way or the other. Except for the beginning and end, every activity should comprise a predecessor and a successor.
In this step, we sequence the activities in the optimum and efficient order to make the best use of the time we have and ensure the project is completed on time.
Here, you can also identify constraints of specific tasks that might (for example) have to start or finish on a specific day.
6. Estimate Resources
Projects require resources, such as money, equipment, skilled and unskilled labour, technology, and raw materials, among others. They must be identified, estimated, and arranged/sourced. We can use estimating techniques like analogous, parametric, three-point, and bottom-up. The resource calendar is also made in parallel to the activity schedule and timeline.
This will also involve creating custom calendars for specific resources if required.
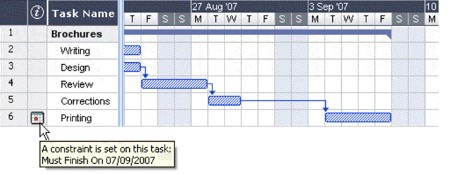
Constraints or Limitations in a Gantt chart (source)
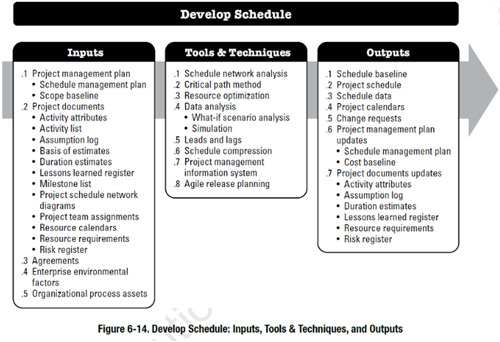
7. Develop a Schedule
We can use Project Management Software like MS Project, Excel, or Primavera to create a full-fledged Gantt Chart. It helps ease the review and editing of the timeline. Make sure response plans and contingencies are incorporated. We can add buffers or margins at the activity and project level to cater to uncertainties.
 Source
Resources to Use
- Microsoft Project is one of the most widely used project management tools. You can also make use of amazing Microsoft Project Gantt Chart templates.
- Microsoft Office provides some resources for Gantt Charts:
- MS Excel is a well-known spreadsheet but is also used for making Gantt Charts.
- MS Word can also be utilized for making Gantt Chart.
- MS PowerPoint provides Gantt Chart integration into presentation slides.
- There are Gantt Chart online tools available as well like Lucid Chart, Team Gantt, and Canva.
Conclusion
A Gantt Chart is the most effective tool we have for planning projects and efficiently executing them. As a CEO or Project Manager, it is useful to have a clear understanding of this amazing tool.
You can check out our Microsoft Project courses to see whether you're ready for a Beginner, Intermediate, or Advanced level of training. With the right amount of training and practice, you can become highly proficient in using the other advanced features MS Project offers.