Australia
 New Zealand
 Singapore
 Hong Kong
 Malaysia
 Philippines
 Thailand
 Indonesia
Top Trainer Picks - Matt's Take on Power BI
This July, Microsoft's Power BI will celebrate its 3rd birthday since public release back in 2015. Therefore, making it still relatively new in the Business Intelligence landscape.
However, Microsoft Power BI was actually available back in 2011. But was built upon the tried and trusted Excel add-on Power Pivot.
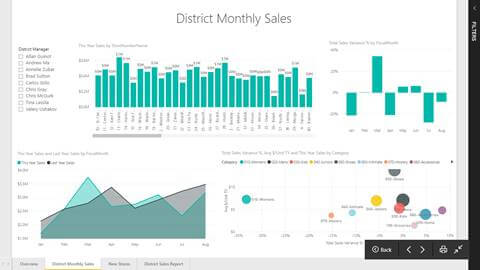
Power BI has been putting the power back in the hands of the decision makers. Business owners, those in a managerial role or generally just those within a decision making role can use the analytics derived from Microsoft Power BI. To make decisions without having to rely on IT analysts or those with an IT background. The creation of visuals (charts and tables) in interactive reports and dashboards used to be the domain of an always under-resourced IT department. Now, they can be easily created by the end user. Users can easily build something that may look like the below:
After a brief introduction to the Power BI interface, a user can create amazing visualisations using their own data. Therefore, with the standard benefits of interactivity between visuals and slicers to dissect the data. You can have these powerful reports in your pocket via the mobile application.
The factors driving the success and energy around Power BI are a reflection of the better strategy Microsoft is committing to.
Power BI is both very simple to grasp but extremely capable for power users who are skilled - or want to be - in the advanced features and associated scripting / programming languages…namely Power Query M Language (although the Power Query UI does an excellent job), Data Analysis eXpressions (DAX) and even incorporating R script.
Also Microsoft are now more willing to ensure their products work with 3rd party data sources. Such as Google, Oracle or various cloud software-as-a-service providers. Plus there is the expected integration with their own data products.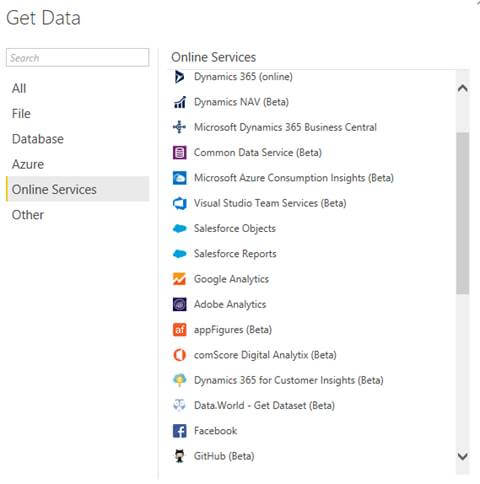
However, the key factor keeping everyone on their toes, in a good way. Is the regular updates of Power BI with additional features appearing on a monthly basis.
Keeping up with the changes is itself a challenge, with the Service, Desktop & Mobile tools all having a new release each month - new functionality, data source connectors and visuals are being added to Power BI.
Some features are in 'preview' mode and need to be enabled. In the online Service you can find Preview Features, if any, in the Settings (via Gear Icon) under General. Most of them are part of the Power BI Desktop tool, found in File - Options and Settings - Options then select Preview Features under the Global heading.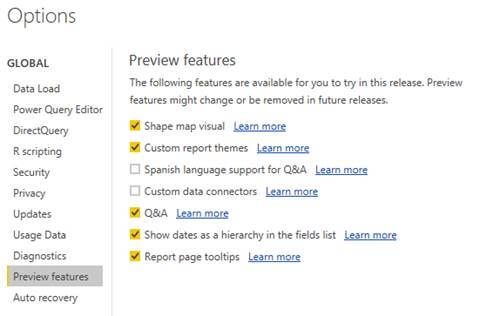
To keep on top of the feature releases, keep a close eye on Microsoft's Power BI Blog - https://powerbi.microsoft.com/en-us/blog/. There is a fantastic community behind Power BI, with plenty of resources available at the click of a (search) button.
Another fantastic resource is our very own Power BI courses. The suite of courses we offer will leave you with a dynamic skill set that will help you take your data analysis and visualisation to the next level.