Will the content in these Excel courses be relevant for the workplace?
Absolutely! Our expertise lies in delivering hands-on training exercises that are applicable to all kinds of workplaces. We cover essential elements such as formula introduction, pivot tables, charting, and more. Moreover, we are happy to discuss and incorporate specific examples tailored to your workplace tasks, ensuring that you receive relevant and practical training. Reach out to us to learn more about our training programs.
While this varies from session to session, we typically have 5-8 students in an Excel class. We cap our classes at 10 students to ensure the quality of training remains of the highest standard, and so all students can ask questions and engage in discussion.
What should I do to prepare for my online course?
You'll need to install the latest version of Excel and ensure you have the appropriate license to use it.
Our Excel Advanced course requires Excel 2016 or later. Windows standalone versions of Microsoft 365 subscription plans are also required.
Microsoft 365 subscription plans are required for the Excel Expert course. You will also need to download and install Power Automate Desktop.
The browser you use is very important. It is recommended you use Chrome, Edge, or Firefox. The latest version must also be installed. Note that Internet Explorer is not compatible with our delivery technologies.
Windows 10 is highly recommended as the operating system you use. If you are using an apple device, use Safari or a similar modern browser if you cannot use any of the browsers recommended above. Your training experience may diminish due to different features and appearances. Nexacu's trainers are unable to provide detailed guidance for macOS.
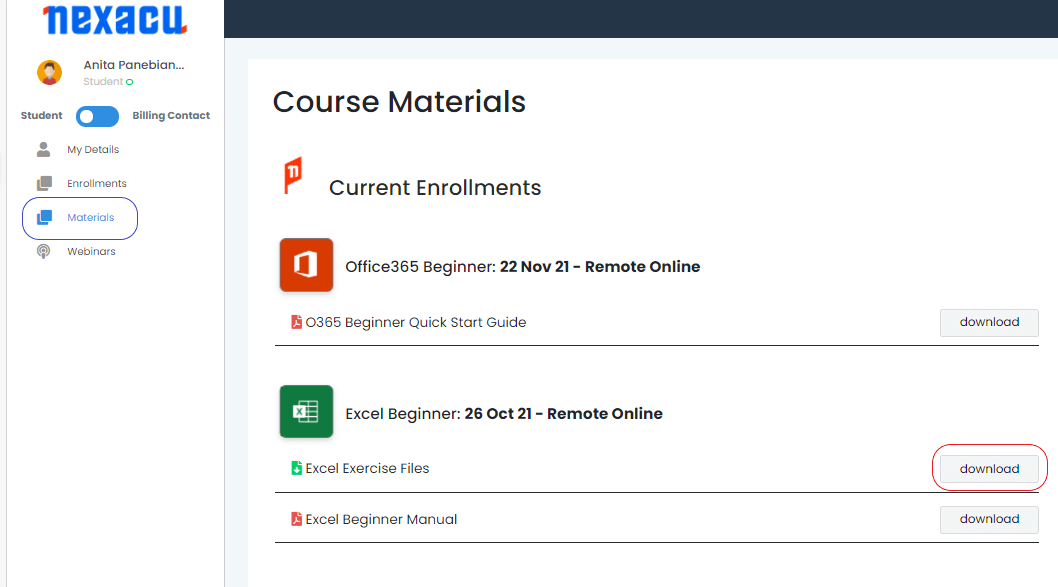
To download and unzip files, log in to your student portal. Click on the "Materials" tab and download your exercise files.

Extract your Exercise Files to the specified folder below:

To save files to the folder specified above create a folder called Exercise_Files_All_Courses on your computer (in This PC). Create another folder under this called Excel Exercise Files. All files should be unzipped or copied to this folder.

 Australia
 New Zealand
 Singapore
 Hong Kong
 Malaysia
 Philippines
 Thailand
 Indonesia


 MO-201 Excel Certification


