Australia
 New Zealand
 Singapore
 Malaysia
 Philippines
 Thailand
 Indonesia

Data has served as the building blocks of organisations in driving strategic decision-making and achieving significant results. This has likewise driven Microsoft Power BI to emerge as a leading business intelligence platform to empower organisations in transforming raw data into actionable insights. This is all thanks to its multifunctional dashboard – and in this article, we will explore diverse use cases of Power BI dashboards and their profound impact on data analysis, visualisation, and decision-making processes within an organisation.
Real-Time Business Monitoring
A Power BI dashboard serves as a dynamic window into an organisation's key performance indicators (KPIs), offering a real-time view of business operations. By consolidating data from various sources such as sales, marketing, finance, and operations, the dashboard provides stakeholders with instant visibility into crucial metrics.
Also, crucial decision-makers can track revenue trends, monitor sales pipelines, analyse customer satisfaction scores, and identify potential bottlenecks. This state-of-the-art and real-time business monitoring empowers organisations to proactively respond to emerging trends, capitalise on opportunities, and address issues promptly, leading to improved performance.
Sales and Marketing Analytics
Power BI dashboards revolutionise sales and marketing analytics by bringing together disparate data sources, including CRM systems, web analytics, and marketing campaigns. With visually compelling charts and graphs, sales and marketing teams can gain deep insights into customer behaviour and sales performance.
Dashboards can also provide a comprehensive overview of key metrics such as lead generation, conversion rates, and customer acquisition costs. By leveraging these insights, organisations can optimise sales and marketing strategies to streamline target market identification and customer experience personalisation.
Financial Reporting and Analysis
Power BI dashboards improve an organisation’s financial reporting and analysis by consolidating data from accounting systems, ERP platforms, and other financial sources. Finance teams can also gain a comprehensive view of key financial metrics such as revenue, expenses, profitability, and cash flow.
Its real-time functionality allows finance professionals to analyse budget variances and efficiently identify cost-saving opportunities. The ability to drill down into specific data points empowers organisations to make informed decisions and take corrective actions when necessary. With Power BI dashboards, financial reporting becomes more efficient, accurate, and transparent enough to facilitate better financial management and support strategic planning.
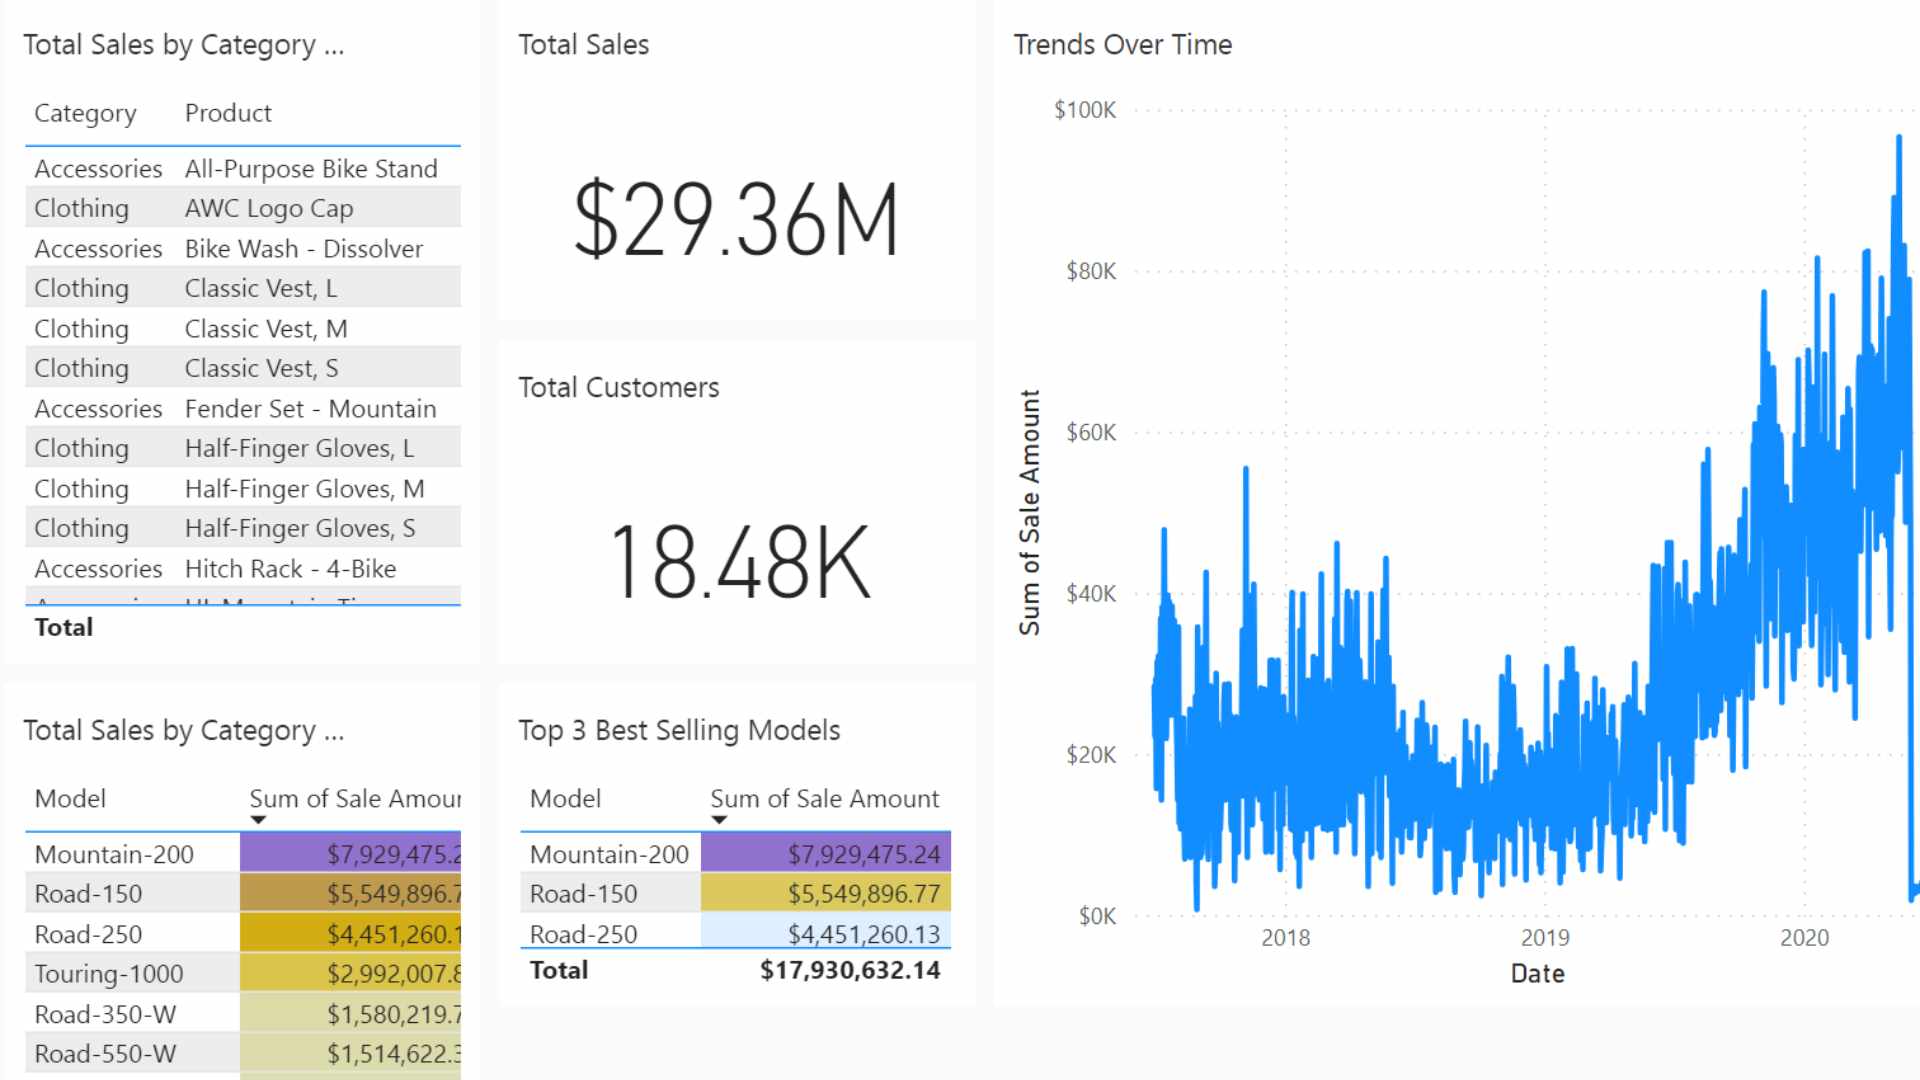
Dashboard example for a Bicycle Sales Dealer
Supply Chain and Operations Management
Power BI dashboards play a crucial role in supply chain and operations management by integrating data from various systems such as inventory management, logistics, and production. Organisations can gain real-time visibility into supply chain processes and optimise overall logistics operations.
These dashboards can also offer insights into key metrics such as on-time delivery and production efficiency. With this information, organisations can identify bottlenecks and reduce costs associated with them. Overall, from an operations perspective, Power BI Dashboards enable data-driven decision-making across the supply chain, fostering operational excellence and driving competitive advantage.
Human Resources and Workforce Analytics
Empowering HR professionals with valuable insights into workforce analytics, Power BI dashboards also enable data-driven decision-making in areas such as talent management, employee engagement, and workforce planning. By integrating data from HR systems, payroll databases, and employee feedback platforms, organisations can monitor the overall performance including their well-being.
Power BI Dashboards can offer this department visualisations of key HR metrics, such as employee satisfaction scores and training success. With these insights, organisations can identify high-potential employees, and address other factors such as retention challenges and employee engagement.
Customer Relationship Management (CRM)
Power BI dashboards provide a comprehensive view of customer relationship management by consolidating data from CRM systems and other customer support platforms. Through this, organisations can analyse customer behaviour, measure customer satisfaction levels, and identify customer support trends.
Included in the dashboards are visual representations of customer demographics, purchase patterns, and service request volumes. This allows organisations to personalise customer experiences, identify cross-selling or upselling opportunities, and promptly address customer issues. This optimisation, later, leads to customer acquisition and retention strategies, enhances customer loyalty, and drives revenue growth.
Risk Management and Compliance
Finally, Power BI dashboards support effective risk management and compliance monitoring by integrating data from various sources such as security systems, regulatory databases, and incident reports. Organisations can gain real-time insights into risk metrics and potential vulnerabilities.
These dashboards can also provide visualisations of key risk indicators, enabling stakeholders to identify and mitigate risks proactively. Compliance dashboards highlight any deviations from regulatory requirements and facilitate compliance reporting. By utilising these dashboards for risk management and compliance, organisations can enhance risk awareness, improve decision-making, and strengthen their overall governance framework.
The Revolutionary Impact of Power BI on Organisations
Power BI dashboards have revolutionised data analysis and decision-making in organisations across various industries. From real-time business monitoring to sales and marketing analytics, financial reporting, supply chain management, HR analytics, CRM, and risk management, Power BI dashboards offer diverse use cases that unlock the power of data.
As organisations continue to embrace data-driven strategies, Power BI dashboards will continue to play a vital role in enabling organisations to harness the full potential of their data and achieve a competitive edge in the dynamic business landscape. With their intuitive interface, powerful visualisations, and real-time analytics, Power BI dashboards empower organisations to make data-driven decisions that drive growth, enhance operational efficiency, and deliver exceptional customer experiences.
Invest in Power BI training and leverage the capabilities of these powerful dashboards. Check out Power BI training courses, and earn the Power BI certification you need to propel your organisation to greater heights.