Australia
 New Zealand
 Singapore
 Malaysia
 Philippines
 Thailand
 Indonesia

Introduction
The transport industry is easily one of the laggards when it comes to adopting innovation. This conclusion also applies to the industry's use of data to drive business decisions beyond conventional wisdom.
Data-driven insights can challenge your assumptions and established ways of operating and help you arrive at strategic business decisions. Microsoft Power BI is one of the popular business intelligence tools that organisations in the transport industry can also adopt.
Analyzing data with Power BI can help you become more proactive in making swift and data-driven changes that can improve business processes, reduce expenses, and ultimately increase the bottom line.
Businesses in the transport sector can take advantage of the different types of data at their disposal to uncover the most viable transporting/logistics option, determine the best route to take, and strategize on the optimal usage of available resources, all with Power BI.
When we talk of the transport industry, we refer to businesses across all modes of travel, logistics companies, supply chain organisations, and people who use them.
In this article, we'll provide an overview of how you can use Power BI to drive business insights and make better data-driven strategic decisions.
Use Cases of Power BI in the Transport Industry
For the transport industry, analytics use cases depend on the types of business data entities in the sector collect and have access to.
The following kind of data is collected in the transport industry and can be analyzed using Power BI:
Shipment data
Details about shipment origin, destination, mode of transport used, time taken, cost of delivery to the company, dimensions and weight, and more.
You can gain a 360-degree view of your shipping journey, infrastructure, and pipeline and thus use key performance indicators (KPI) to identify where performance gaps exist.
Routing data
Data about the chosen route(s), like length, modes of transport available on the route, cost of using the path, availability/non-availability of the route during the different months of the year, alternative pathways, and the cost of using a route.
Analysis of this data will help you maximize how you use resources, especially in identifying protocol anomalies and routes that have become redundant or less efficient.
Modes of transport
All available modes, whether owned/leased/outsourced, availability during the year, time and costs incurred, and any effects on the safety and fitness of the shipment.
Sales and employee performance data
Data analysis of sales data and employee performance can help you in many ways. Firstly, it can help you segment employees into high-performing, average, and below-average.
If many employees fall into the latter category, then perhaps your recruitment and onboarding system needs to change.
You can then find the peculiarities of the high-performers in a bid to create a profile for your hiring team.
Data about incoterms
These are pre-defined commercial terms relating to international commercial law), legal obligations, seasonal swings, the best or worst consignees, and the best or worst logistic partners.
Interoperation data
The logistics industry also tracks conflicts, exclusivity, debarment, and cooperation that may exist between the above data topics.
For example, an air route might be the only option during the winter season, OR certain items might be prohibited from entering a territory, thus making the related route unfeasible.
Visualization, implementation, and integration of data in the transport industry
Analysts analyze data to get actionable insights into the various processes and uncover hidden facts/trends.
The data available to the sector is multi-faceted and could come in various formats and sizes at varying speeds. Hence, companies need a powerful and versatile tool like Power BI to visualize it.
Note: The data and charts below have been anonymized to hide confidential information. They are just for illustrative purposes.
Some common reports used in the transport industry
Below are some common reports you’ll likely use for data storytelling and supply chain management:
Profit and loss report
This report tells you the profits and the losses incurred across all the operational routes.
As you send shipments between cities and countries, this report analyses the time and cost taken to reach the destination and a few other factors.
It tells you your most profitable routes, routes that incur losses or are not viable, and goods and consignees' contributions.
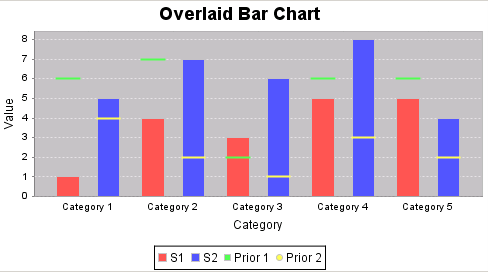
For example, a bar chart can quickly show you the most profitable countries/cities you operate.
Additionally, you can drill into this report to show details like the most profitable direction, which group of goods/consignments contributed most to the profits, the best and worst consignees, and more.
Power BI also lets you filter the results based on time, margins, and geographies.
Power BI's fine-grained control can help you detect shipments that arrived on time or earlier than expected or were late.
You can also easily switch to a tabular data view to know the exact numbers behind the logistics dashboard or to confirm your findings.
Most beneficial and most loss-making routes/categories, emerging or prospective alternate routes
When you match your profits/losses with the routes/geographies they emerge from, you can easily discern which routes are causing the most losses and the most profitable ones.
You can also clearly see which routes are providing higher than the average profit and are consistently doing so. These are your emerging routes that, if taken care of, could turn into high-profit routes.
Also, the routes from which the profits are continuously diminishing or lagging.
With some brainstorming, you can also know if optimizing routes that are in and around profit-making routes could be more beneficial.
Or if closing a route/branch could lead to better deployment of resources towards routes with higher bottom lines.
Monthly, quarterly, and yearly performance of your business and the employees
This report can help you segregate the best performers from those employees that need to improve.
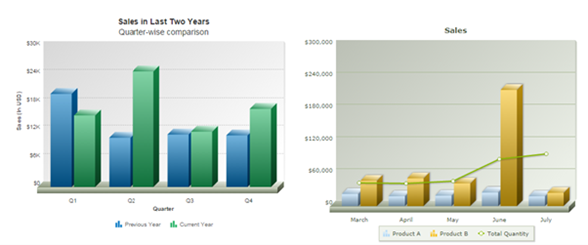
You can know your lean months, which you can use to consolidate your infrastructure and introduce corrections to existing processes.
Apart from the benefits above, other tangible benefits are evident.
Some of the categories that can benefit from them are listed below:
- Truck: You could find the trucks giving the best return on investment and those that may need overhauling or replacement. The routes that best lend themselves for trucking can also be easily known.
- Plane: Consignments that must be delivered fast are best delivered via the air. These logistics dashboards, and reports can help you decide the best air routes for which you can take fast/prime bookings. Also, if you’re using other carriers to deliver your cargo, which is the best amongst them?
- Ship: Heavier consignments that are in no hurry to be delivered OR that need a time delay to ripen before delivery are best served by the ship/waterways route. Again, these reports can help you optimize your shipping infrastructure and routes.
Common challenges in the transport industry
The transport industry faces many barriers to optimal performance and efficiency, including the following:
Poor traffic and weather predictions
A shorter route may end up consuming more resources than a longer route due to poor or no traffic predictions. Poor weather predictions can cause delays or rerouting, all of which affect the speed of delivery.
Cost of fuel
The transport industry is susceptible to the volatile nature of the crude oil market. This volatility makes it difficult to plan and appraise the cost of transport services. Many players in the sector need to improve their supply chains to reduce fuel costs.
Cost of fleet maintenance
Fleet maintenance covers a sizable chunk of a transport business’ operational cost.
Shortage of skilled drivers
There’s a critical lack of skilled drivers in the Australian transportation sector. To this end, the Australian Trucking Association has been having regular dialogue with the government to find short and long-term solutions to this issue.
Technology, automation and data analytics have a role to play in overcoming most of these challenges, hence why adopting data and Power BI is of utmost importance.
Ultimately all these barriers impact the speed and delivery times of each consignment, which might affect expenses and profits.
Benefits of using Power BI in the transport industry
There are other tools for analyzing business functions and generating reports, dashboards, and visualization, such as Tableau, Python, and Excel, but why Power BI?
Below, we’ve provided some benefits of using Power BI.
Power of visualization with more granular insights
Power BI has a versatile rich set of charts/graphs to suit every purpose. You can choose the best graph for an insight to make its meaning plain to anyone who sees it.
Users can also personalize charts and dashboards to isolate information per geography, product, salesperson, and much more, using Power BI’s interactive features.
Mobile use of Power BI for on-the-go fleet monitoring
Power BI lends itself easily to mobile usage. Its exclusive mobile-friendly interfaces make viewing and comprehending reports easy on any device.
You can have different versions of your reports for laptop screens and mobile devices.
The reports and charts on mobile devices have a smaller code footprint for quick drawing and crisp displays to minimize loss of comprehension, if any.
Power of data-driven decisions
Decisions based on data and insights are more factual and extremely likely to lead to the desired outcome.
In contrast, just making decisions based on obvious hints or your gut feeling, without uncovering hidden facts, is highly likely to cause a mistake.
Expanded ecosystem for less expenses
With the release of Microsoft Fabric, Power BI has become a part of a unified analytics platform that provides all data needs a company might have. Azure Data Factory and Azure Synapse Analytics are other tools under a single product.
Having all your data toolkit under one product streamlines how much you need to spend and your hiring needs.
Artificial Intelligence and Copilot for more accurate traffic and weather predictions
Copilot, as the name suggests, can help you uncover insights faster. Having Copilot is like giving ChatGPT access to your data, asking it to analyze the data, and then asking ChatGPT to provide visualizations.
Power BI also comes with AI capabilities that enable you to do what data scientists do, such as building machine learning models that could help you make better traffic and weather predictions.
Takeaway: Power BI enables powerful visualizations for data-driven strategic decisions in the transport industry
The transport industry can leverage the different types of data at its disposal to improve processes and operational efficiencies.
Insights can then be translated into visualizations that decision-makers and stakeholders can easily understand and draw inferences from.
Power BI is a powerful tool for telling data stories with graphs, charts, and plots. Your employees must know how to create and interpret Power BI charts.
At Nexacu, we take pride in upskilling teams across Australia and New Zealand in Microsoft Applications, including Power BI. Check out our suite of Power BI courses from beginner to advanced, remote and in-class.
Contact us today to get a quote for your team members.