Australia
 New Zealand
 Singapore
 Hong Kong
 Malaysia
 Philippines
 Thailand
 Indonesia

Excel & R
As software trainers, we are asked a lot of questions about the best or easiest ways to approach a wide range of data problems. Our trainers have a vast breadth of experience and these conversations often become brainstorming sessions that lead to new discoveries.
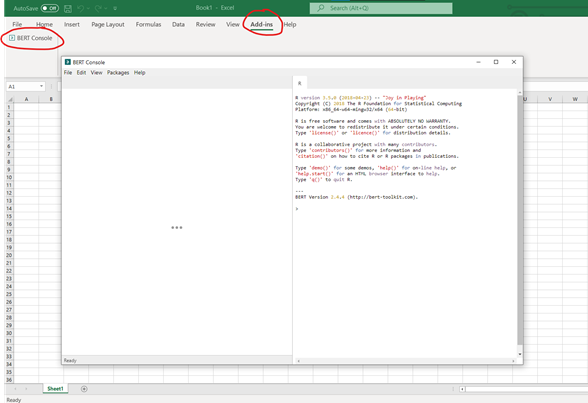
One of these recent discoveries is BERT aka the Basic Excel R Toolkit. This is a package for working with R programming language functions from Excel. It's a wonderful resource for adding functionality to Excel and best of all, it is free!
Why work with Excel?
Excel is an excellent, widely-used tool for manipulating, analysing and visualising data in a point-and-click environment. Learning Excel is relatively easy and can be picked up quite quickly but it is also powerful with more advanced capabilities for users who want to utilise them.
However, compared to a statistical programming language like R, Excel has some limitations.
Why work with R?
R is a widely-used statistical programming language. Its development has been driven by a very active, highly-skilled user community. The community have contributed over 18,000 packages to enable users to access, collect, manipulate and analyse data, create complex models and produce high-quality data visualisations. With R you can do everything from web scraping to machine learning. It is also free to use.
Combining Excel and R
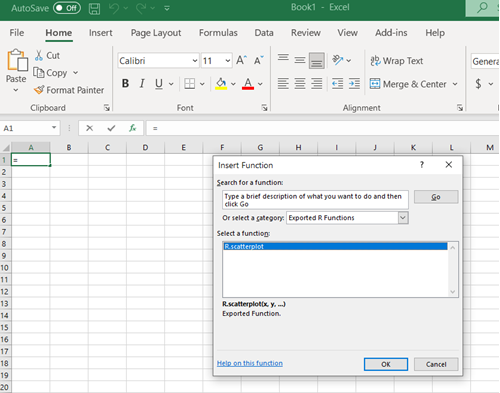
Combining these two tools gives users the best of both worlds; an environment where data is easily viewed and manipulated plus access to more complex analysis algorithms and graphing functionality. R graphics can be embedded in the Excel worksheet for easy saving and sharing. They will update if the data changes. R functions that users create can be used from the GUI, just like any Excel function. More complex R scripts can be run from the BERT console.
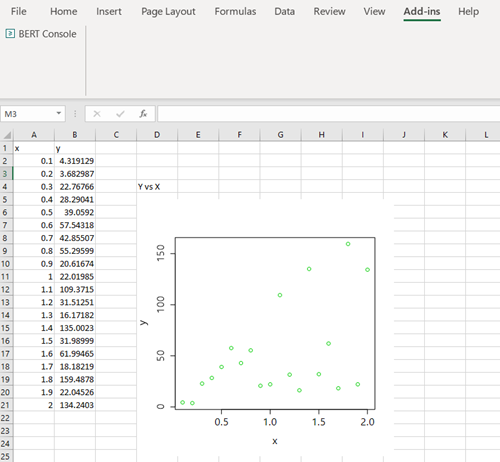
Creating an R visualisation in Excel
In this case, a simple R function was created, called scatterplot. It takes two arguments, x and y, which are provided from data within the spreadsheet. It returns the scatterplot in the Excel worksheet.
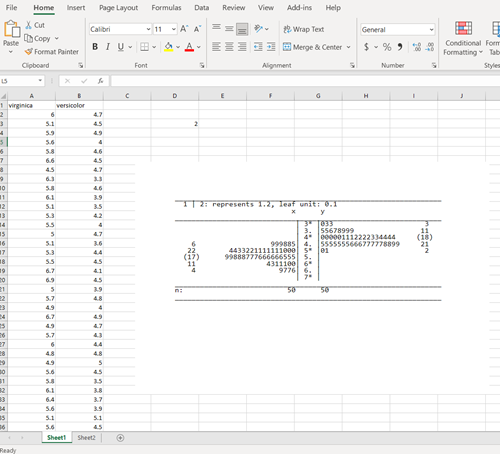
Stem and leaf plot
The original query that started the discussion about using R functionality within Excel was from an Excel user who wanted to create stem and leaf plots. These kinds of plots are very simple to construct in R but are very painstaking to do manually in Excel. We can use BERT to streamline this process, with a function that creates stem and leaf plots from data in the spreadsheet and puts the text output in the worksheet in the Excel file.
If you'd like to learn more about working with R, check out our R programming courses. Our courses start with the absolute basics for people who have never used code before and our certification programs provide students with the practice and support to become proficient in a short timeframe.